Add XRD Measurements
This guide explains how to add X-ray Diffraction (XRD) structural characterization data to your combinatorial library in NOMAD Oasis.
Overview
XRD provides structural information including crystal phases, lattice parameters, and orientations. This guide covers:
- Creating an XRD measurement entry
- Uploading multiple data files
- Reviewing auto-generated diffraction plots
- Managing measurement points
Prerequisites
Before starting, you need:
- Completed sputtering upload with combinatorial libraries
- XRD data files - Individual files for each measured point
- Knowledge of which quarter you measured (BL, BR, FL, FR)
File Format
XRD files are typically .xy, .xrdml, .raw, or similar formats containing 2θ angle vs. intensity data.
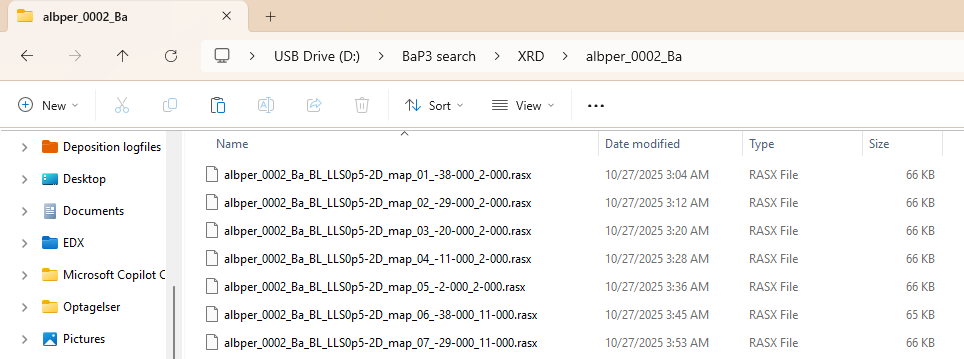
Step 1: Prepare Your XRD Files
Organize your XRD data files. They should look like:
Measurement Strategy
- Full quarter mapping: Upload all points from one quarter
- Selected points: Upload specific interesting positions only
- Individual points: Upload single positions for quick checks
Quarters uploaded individually are recommended for organization.
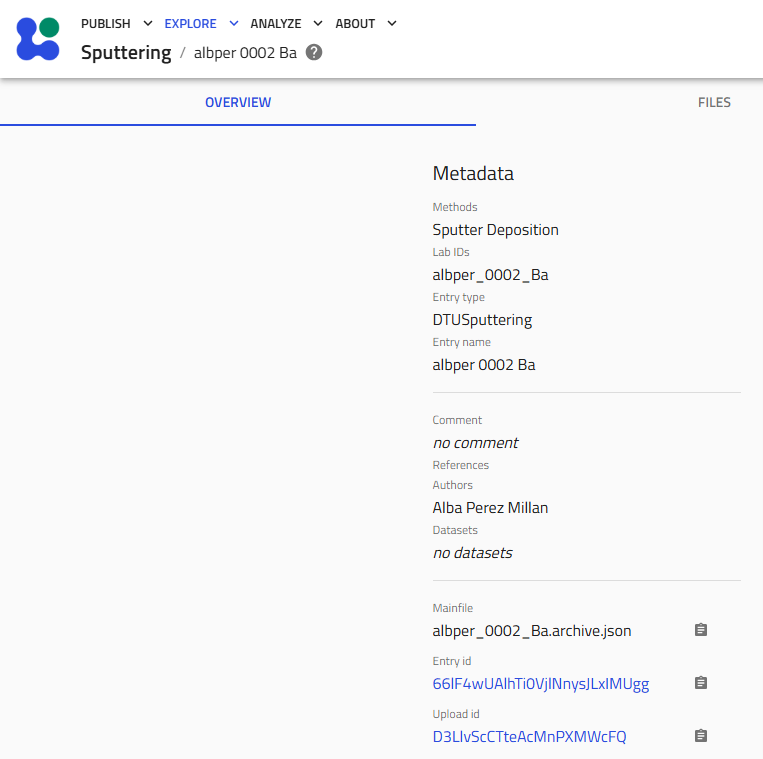
Step 2: Navigate to Your Upload
-
Go to the sputtering upload where your combinatorial libraries were created
-
Click on the upload to open it
Step 3: Create XRD Measurement Entry
3.1 Start Schema Creation
Click "Create from schema" in your upload.
3.2 Name and Select Schema
Follow the naming convention:
Examples:
amazingresearcher_0042_CuZn_BL_XRD(back left quarter)username_0123_BaZr_FR_XRD(front right quarter)
Select the schema:
- Choose "XRD Measurement" from the Built-in schemas dropdown
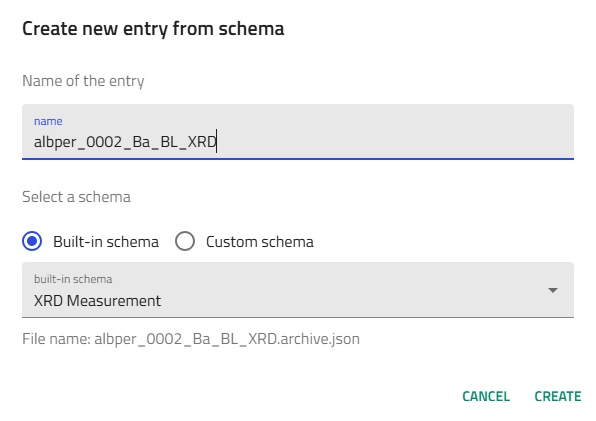
Click "Create".
Step 4: Upload XRD Data Files
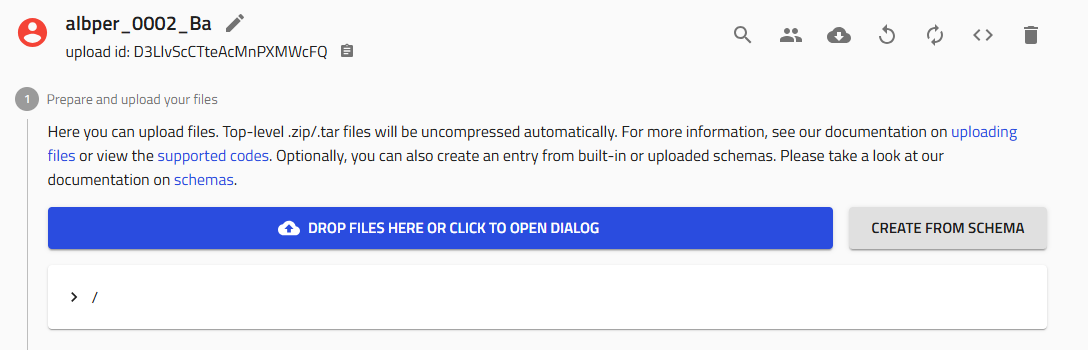
4.1 Locate the File Upload Field
Scroll down to find the "Data files" field in the XRD measurement entry.
4.2 Upload Multiple Files
- Select all your XRD data files for this quarter:
- Use Ctrl+Click (Windows/Linux) or Cmd+Click (Mac) to select multiple files
-
Or drag and drop all files at once
-
Upload to the "Data files" field
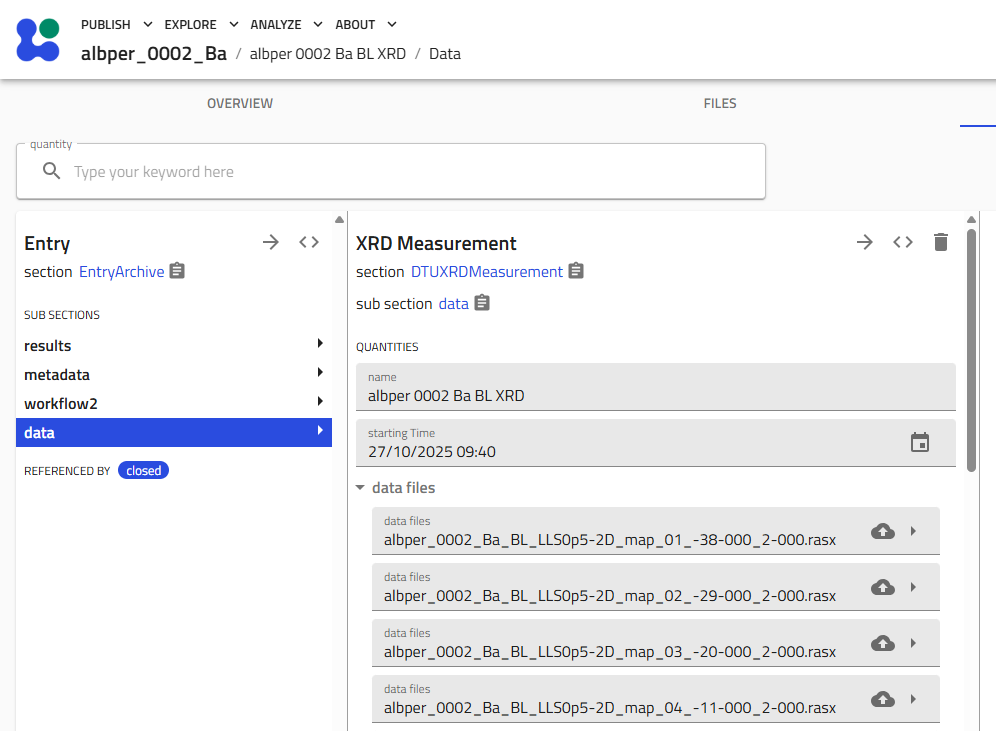
- IMPORTANT: Click "Save" immediately after upload completes
Must Save!
Always click "Save" after uploading files. Unsaved uploads will be lost.

Processing
NOMAD processes each XRD file to extract:
- 2θ angle ranges
- Intensity patterns
- Measurement positions on the sample
- Peak positions and intensities
Step 5: Review Results
5.1 Navigate to Results Subsection
Scroll down to the "Results" subsection and expand it.
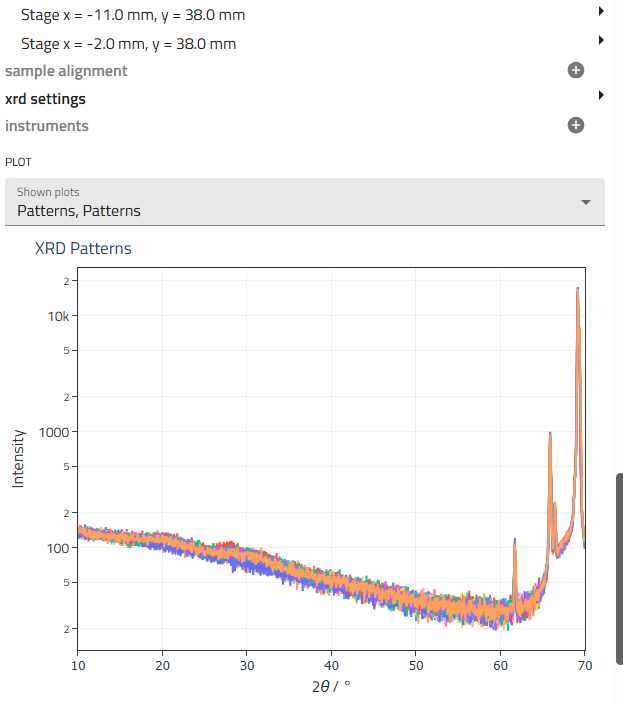
5.2 Examine Auto-Generated Plots
NOMAD automatically generates visualizations showing:
- Individual diffraction patterns for each point
- Overlay plots comparing multiple positions
- 2θ vs. intensity for all measurements
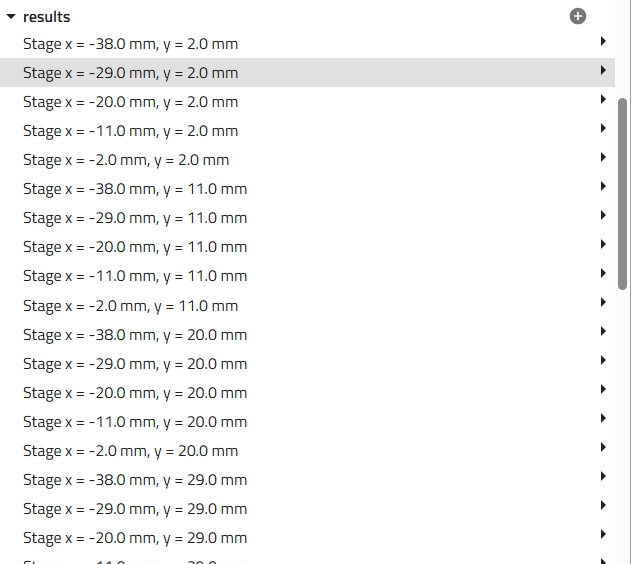
All measurement points are displayed in the graphs, allowing you to:
- Compare phases across composition space
- Identify structural transitions
- Locate amorphous vs. crystalline regions
5.3 Optional: Remove Invalid Points
If you measured incorrect positions (bare substrate, wrong sample, etc.):
-
Locate the data point in the list
-
Click the trash can icon next to the invalid point
-
Click "Save" after deletion
When to delete points
Unlike EDX where substrate hits are common, XRD measurements are typically more controlled. You'll rarely need to delete points unless you explicitly measured the wrong location.
Step 6: Repeat for Additional Quarters
If you measured multiple quarters, repeat this process for each:
- Create a new XRD Measurement entry with the appropriate quarter identifier:
username_####_Material_BR_XRDusername_####_Material_BL_XRDusername_####_Material_FL_XRD-
username_####_Material_FR_XRD -
Upload the corresponding XRD files
-
Review results and clean data if needed
Organization Benefits
Separate entries per quarter:
- Keeps file counts manageable
- Matches physical sample division
- Enables quarter-specific analysis
- Parallels EDX organization
Verification Checklist
After uploading XRD data, verify:
- [ ] Entry named correctly with quarter identifier
- [ ] All XRD files uploaded successfully
- [ ] Results subsection shows diffraction patterns
- [ ] Data points correspond to expected positions
- [ ] Patterns show reasonable peak intensities
- [ ] Final save completed
- [ ] No obvious file upload errors
Troubleshooting
No plots appear in Results section
Problem: Results subsection is empty after upload
Solutions:
- Verify files are in supported XRD format
- Check that files aren't corrupted (open in analysis software)
- Confirm you clicked "Save" after upload
- Refresh the page and wait for processing to complete
- Check upload status for error messages
Some files didn't upload
Problem: Expected file count doesn't match uploaded count
Solutions:
- Check file size limits (typically <10 MB per file)
- Verify all files were selected before uploading
- Try uploading in smaller batches
- Ensure files aren't open in another program
- Check file permissions
Diffraction patterns look wrong
Problem: Plots show unexpected peak positions or intensities
Solutions:
- Verify you uploaded files from the correct measurement
- Check that files haven't been modified or corrupted
- Confirm the quarter identifier matches the actual measured quarter
- Review raw files in your XRD analysis software
- Check for correct wavelength/radiation type in metadata
Can't delete data points
Problem: Trash icon missing or not working
Solutions:
- Ensure you're in edit mode
- Check you have write permissions
- Try refreshing the page
- Verify the entry isn't published/locked
File format not recognized
Problem: Upload rejects your XRD files
Solutions:
- Check the supported file formats with your NOMAD administrator
- Export data in a different format from your XRD software
- Verify files aren't compressed (.zip, .rar, etc.)
- Ensure file extensions are correct and lowercase
Understanding XRD Data
What does XRD measure?
XRD provides:
- Crystal structure - Phase identification (cubic, tetragonal, etc.)
- Lattice parameters - Unit cell dimensions
- Crystallinity - Relative amounts of crystalline vs. amorphous material
- Preferred orientation - Texture information
- Phase purity - Presence of multiple phases
Measurement considerations:
- Penetration depth: X-rays probe full film thickness plus substrate
- Spatial resolution: Spot size typically 1-10 mm (larger than EDX)
- Substrate peaks: Silicon substrate peaks will appear in patterns
- Thin film effects: May see broad peaks or weak intensities
Data interpretation:
Use the visualizations to:
- Map phase evolution across composition gradients
- Identify composition regions with desired crystal structures
- Track structural transitions (e.g., amorphous to crystalline)
- Compare experimental patterns to reference databases
Next Steps
After adding XRD measurements:
- Add EDX Measurements - Correlate structure with composition
- Add Ellipsometry Measurements - Add optical properties
- Add Other Characterization - XPS, PL, Raman
- Jupyter Analysis - Create custom structure-property plots
Related Resources
- Upload Sputtering Data - Create parent combinatorial library
- XRD Reference - Detailed schema documentation
- Tutorial - Complete workflow example
- Characterization Techniques - Understanding XRD in context
Need Help?
If you encounter issues:
- Ask colleagues who have uploaded XRD data successfully
- Review example XRD uploads in your group
- Check the Reference Documentation
- Contact DTU Nanolab NOMAD support