Add EDX Measurements
This guide explains how to add Energy-Dispersive X-ray Spectroscopy (EDX) composition measurements to your combinatorial library in NOMAD Oasis.
Overview
EDX provides elemental composition at specific points on your sample. This guide shows you how to:
- Create an EDX measurement entry
- Upload Excel data files
- Review auto-generated plots
- Clean up invalid data points
Prerequisites
Before starting, you need:
- Completed sputtering upload with combinatorial libraries
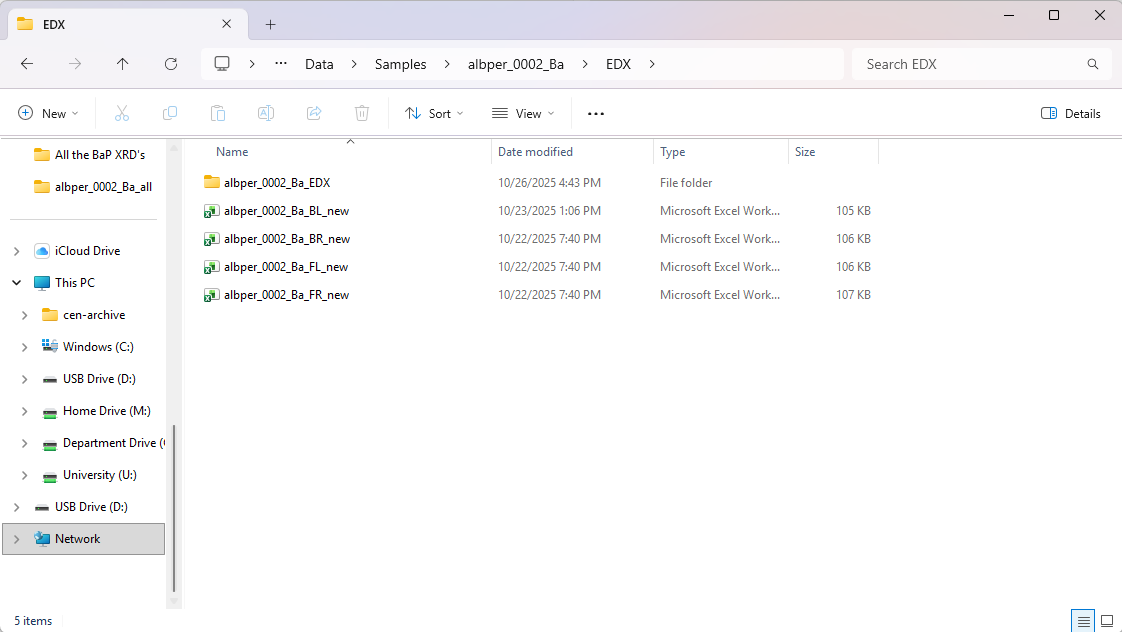
- EDX Excel files - One per measured piece/quarter
- Knowledge of which quarter you measured (BL, BR, FL, FR)
File Format
Your Excel files should contain position coordinates and elemental compositions for each measurement point.
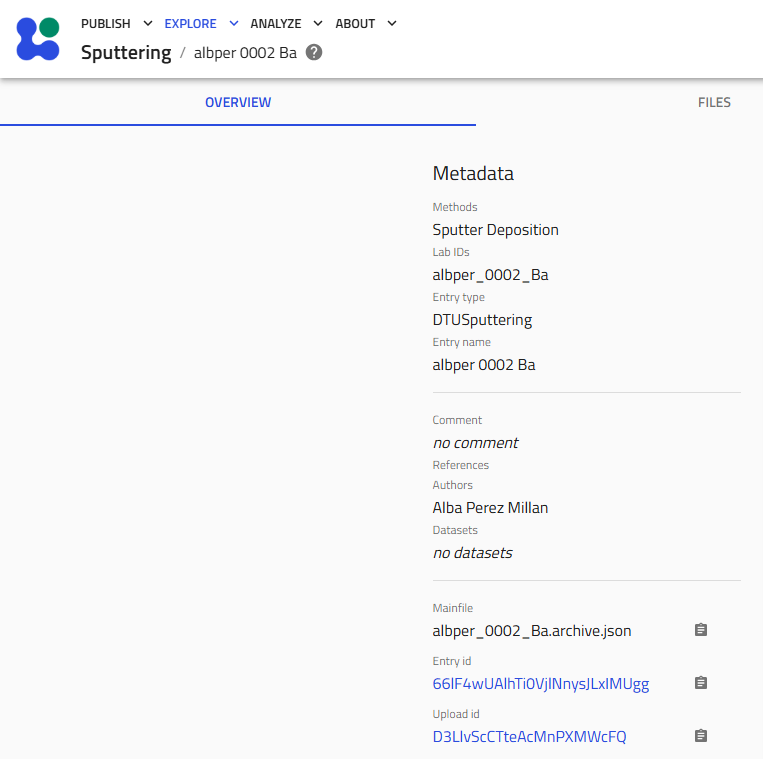
Step 1: Navigate to Your Upload
-
Go to the sputtering upload where your combinatorial libraries were created
-
Click on the upload to open it
Finding Your Upload
Use the search function or filter by your username to quickly locate your uploads.
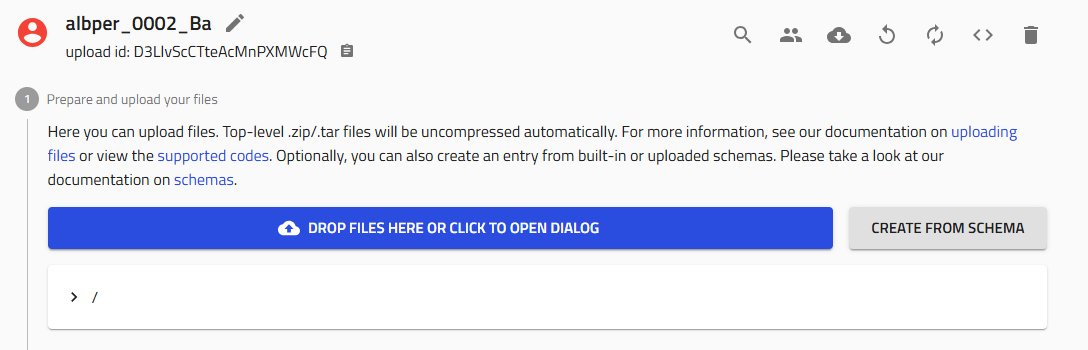
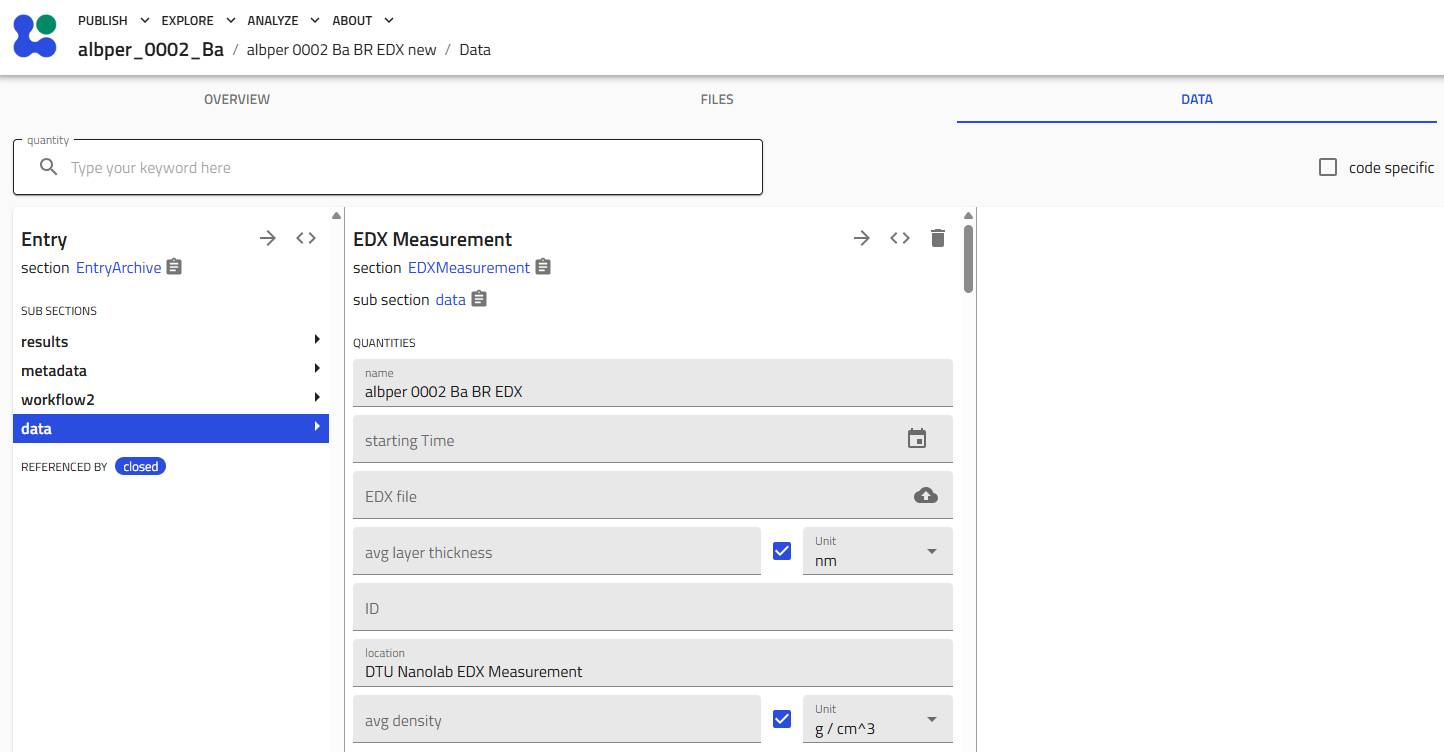
Step 2: Create EDX Measurement Entry
2.1 Start Schema Creation
Click "Create from schema" in your upload.
2.2 Name and Select Schema
Follow the naming convention:
Examples:
amazingresearcher_0042_CuZn_BR_EDX(back right quarter)username_0123_BaZr_FL_EDX(front left quarter)
Select the schema:
- Choose "EDX Measurement" from the Built-in schemas dropdown
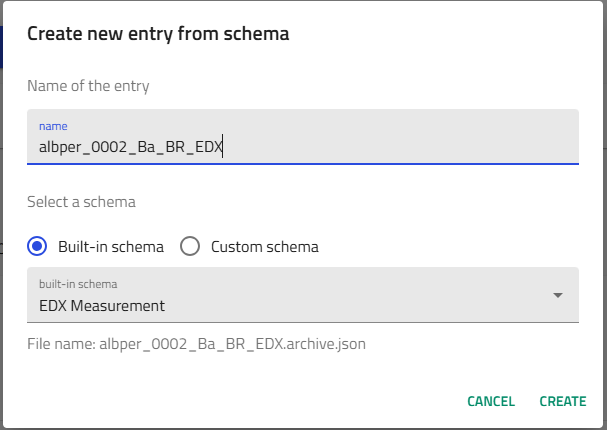
Click "Create".
Step 3: Upload EDX Data
3.1 Locate the File Upload Field
Scroll down to find the "EDX file" field.
3.2 Upload Your Excel File
-
Click the upload area or drag and drop your Excel file
-
IMPORTANT: Click "Save" immediately after the file uploads
Must Save!
Failing to save after uploading will result in data loss. Always click "Save" after file uploads.

Processing Time
NOMAD processes the file and extracts:
- Measurement positions (x, y coordinates)
- Elemental compositions (atomic %)
- Relationships to the combinatorial library geometry
3.3 Upload Native EDX Archive (native_archive)
To preserve native EDX provenance, also upload the raw archive in the Native data archive field (native_archive).
- Create a folder containing:
- The
.oipxfile - Its associated data folder
- The
- Name this folder using either:
- combinatorial library style e.g.
eugbe_0032_Zr_FL_EDX(if the file contains data from a single library) - The process-run style, e.g.
eugbe_0032_Zr_EDX(if the file contains data from different libraries)
- combinatorial library style e.g.
- Compress that folder to a single
.zipfile. - In the EDX entry, upload this
.zipin Native data archive. - Click Save.
- Trigger normalization (if not automatic in your deployment) by using the normalize/reprocess action.
Why upload native archive?
The native archive keeps the original instrument bundle (.oipx + companion files) for traceability and future re-processing.
Step 4: Review Results
4.1 Navigate to Results Subsection
Scroll down to find the small "Results" subsection and expand it.
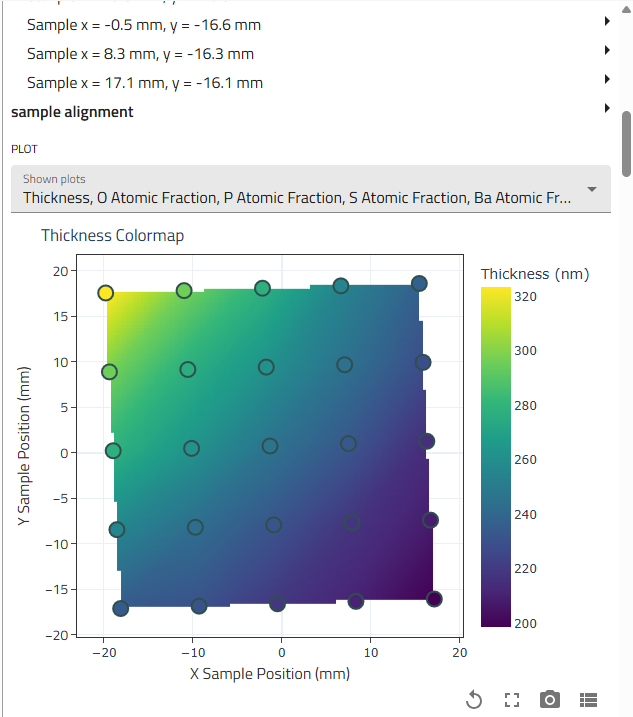
4.2 Examine Auto-Generated Plots
NOMAD automatically generates visualizations showing:
- Composition vs. position
- Elemental distributions across the measured area
- Individual data points overlaid on the sample geometry
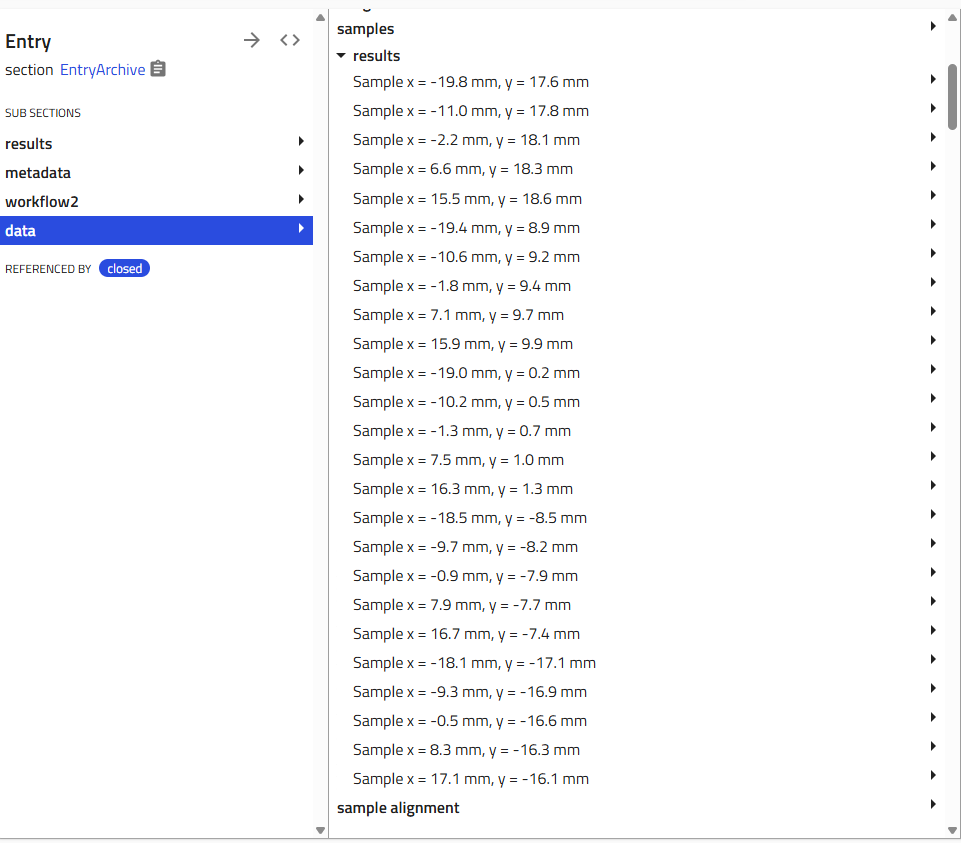
All measurement points from your Excel file are displayed in the graphs below.
Step 5: Clean Invalid Data Points
During EDX mapping, you might accidentally measure:
- Areas with no film (bare substrate)
- Wrong sample regions
- Contamination spots
These invalid points should be removed.
5.1 Identify Bad Points
Review the plots and identify suspicious data:
- Compositions far from expected values
- Points in regions you didn't deposit
- Outliers inconsistent with neighboring points
5.2 Delete Invalid Points
-
Locate the data point in the list (usually shown with coordinates)
-
Click the trash can icon next to the invalid point
-
Click "Save" after each deletion
Save After Each Deletion
Changes aren't final until you save. Always click "Save" after removing points.
5.3 Re-check Plots
After removing invalid points, scroll back to the Results section to verify:
- Plots show cleaner composition gradients
- Outliers are removed
- Data makes physical sense
Step 6: Repeat for Additional Quarters
If you measured multiple quarters of your combinatorial library, repeat this entire process for each quarter:
- Create a new EDX Measurement entry with the appropriate quarter name:
username_####_Material_BR_EDXusername_####_Material_BL_EDXusername_####_Material_FL_EDX-
username_####_Material_FR_EDX -
Upload the corresponding Excel file
-
Review and clean data points
Mapping Strategy
Quarters are commonly measured individually. This allows:
- Dedicating quarters to different techniques
- Focusing EDX on interesting composition regions
- Parallel processing of characterization
Verification Checklist
After uploading EDX data, verify:
- [ ] Entry named correctly with quarter identifier
- [ ] Excel file uploaded successfully
- [ ] Native archive
.zipuploaded innative_archive - [ ] Normalization completed
- [ ] Results subsection shows plots
- [ ] Data points appear in expected positions
- [ ] Invalid points removed
- [ ] Final save completed
- [ ] Composition gradients look reasonable
Troubleshooting
No plots appear in Results section
Problem: Results subsection is empty or shows errors
Solutions:
- Check Excel file format - ensure it matches expected structure
- Verify file uploaded successfully (no error messages)
- Refresh the page and check again
- Confirm you clicked "Save" after upload
Can't delete data points
Problem: Trash icon missing or not working
Solutions:
- Make sure you're in edit mode (not just viewing)
- Try refreshing the page
- Check you have write permissions on the upload
- Verify the entry isn't locked or published
Wrong data appears in plots
Problem: Plots show unexpected composition values or positions
Solutions:
- Verify you uploaded the correct Excel file
- Check if the file corresponds to the correct quarter
- Ensure Excel file wasn't corrupted or modified
- Confirm measurement positions match library geometry
Excel file won't upload
Problem: File rejected or error during upload
Solutions:
- Verify file is in Excel format (.xlsx or .xls)
- Check file size isn't too large (typically ≤ 5 MB)
- Ensure file isn't password-protected
- Try opening in Excel to verify it's not corrupted
- Re-export from your EDX analysis software
Understanding EDX Data
What does EDX measure?
EDX provides:
- Elemental composition at each measurement point (atomic % or weight %)
- Spatial distribution of elements across your sample
- Composition gradients created by multi-target sputtering
Measurement considerations:
- Penetration depth: EDX samples several microns deep
- Spatial resolution: Typically ~1 micron lateral resolution
- Light element detection: Limited sensitivity for elements lighter than carbon
- Surface sensitivity: Surface contamination can affect results
Data interpretation:
The visualizations help you:
- Identify composition ranges achieved in your library
- Locate specific compositions of interest
- Track gradient directions and magnitudes
- Validate against target compositions
Next Steps
After adding EDX measurements:
- Plot Combinatorial EDX Data - Visualize the full library
- Add XRD Measurements - Add structural characterization
- Add Ellipsometry Measurements - Add optical properties
- Add Other Characterization - XPS, PL, Raman, etc.
Related Resources
- Upload Sputtering Data - Create the parent combinatorial library
- EDX Reference - Detailed schema documentation
- Tutorial - Complete workflow example
- Combinatorial Libraries - Understanding the data model
Need Help?
If you encounter issues:
- Ask colleagues who have successfully uploaded EDX data
- Review example uploads in your group
- Check the Reference Documentation
- Contact DTU Nanolab NOMAD support