Add Ellipsometry Measurements
This guide explains how to add ellipsometry optical characterization data to your combinatorial library in NOMAD Oasis.
Overview
Ellipsometry provides optical properties including film thickness, refractive index (n), and extinction coefficient (k). This guide covers:
- Exporting data from CompleteEASE software
- Creating an ellipsometry measurement entry
- Uploading n&k, thickness, and tabulated data files
- Uploading native CompleteEASE files (.se and .snapshot)
- Reviewing auto-generated plots
Prerequisites
Before starting, you need:
- Completed synthesis upload with combinatorial libraries
- Ellipsometry measurement snapshot files - CompleteEASE
.snapshotfiles - Knowledge of which quarter you measured (BL, BR, FL, FR)
- Access to CompleteEASE software - For data export
File Format
You'll need to export five files from CompleteEASE:
- n&k file (
.txt) - Refractive index and extinction coefficient vs. position - Thickness file (
.txt) - Thickness, roughness, MSE, and other fit parameters - Tabulated data file (
.txt) - Raw Psi/Delta table exported from CompleteEASE - Native data file (
.se) - Native CompleteEASE data file - Snapshot file (
.snapshot) - Original measurement file (for archival)
Step 1: Export Data from CompleteEASE
1.1 Transfer Data from Instrument
- Move the measurement data with a USB stick from the ellipsometer to a separate computer
- Store data on the O: drive or your designated storage location
1.2 Open CompleteEASE Software
- Launch the Remote Desktop Connection software on your PC
- Connect to the remote computer DTU-8CC0321MFL
- Open the CompleteEASE software
1.3 Load Your Snapshot
- Go to Analysis → Open Snapshot → Browse file system
- Navigate to your measurement file and open it
1.4 Fit Data for All Points
- In the software, fit the ellipsometry data for all measured points
- Ensure all fits converge and show reasonable MSE (Mean Squared Error) values
Quality Check
Review the MSE values - lower values indicate better fits. Typical values should be ≤ 10 for good fits.
1.5 Export n&k Data
To export the refractive index (n) and extinction coefficient (k):
- Right-click into the fitting window
- Select "Graph OCs Vs. Position"
- Choose the optical constant type to graph:
- Select n & k (complex refractive index)
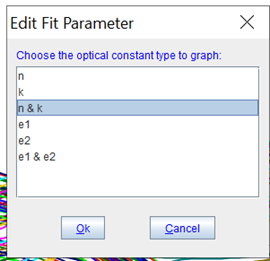
- Right-click into the plot that appears
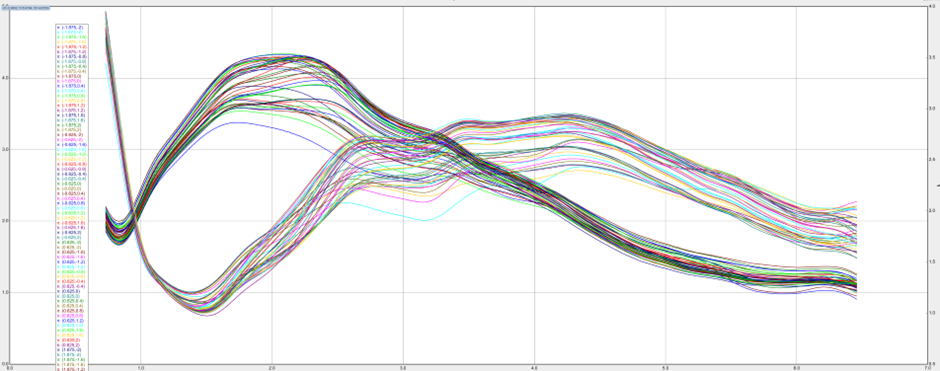
- Select "Copy Data to Clipboard"
- Paste the data into a new text file
- Save with naming convention:
username_####_Material_Quarter_nk.txt
Example filename: eugbe_0020_Zr_BR_nk.txt
This is your n&k file for uploading to NOMAD.
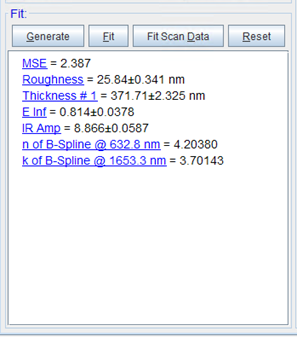
1.6 Export Thickness Data
To export thickness and other fit parameters:
- Left-click on Thickness in the fitting window (or other parameters like Roughness, E inf, etc.)
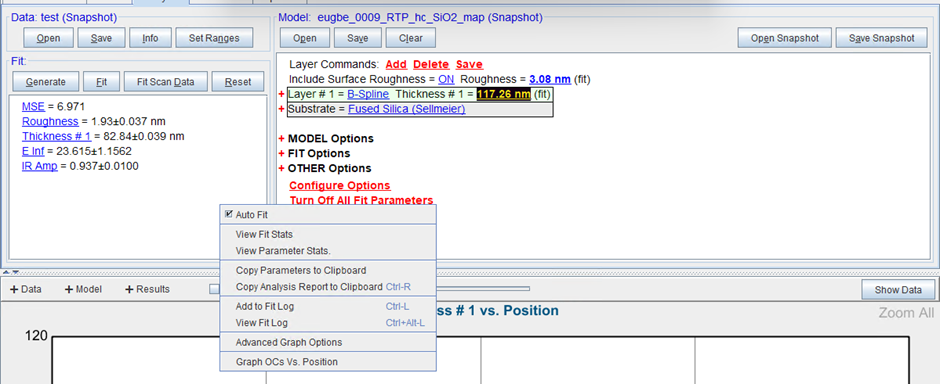
- Click "Copy Parameters to Clipboard"
- Paste the data into a new text file
- Save with naming convention:
username_####_Material_Quarter_th.txt
Example filename: eugbe_0020_Zr_BR_th.txt
This is your thickness file for uploading to NOMAD. It contains:
- Film thickness at each position
- Surface roughness
- MSE (fit quality metric)
- Other fitted parameters
1.7 Export Tabulated Data File (.txt)
To export the tabulated raw ellipsometry data from CompleteEASE:
- In CompleteEASE, go to Analysis → Data tab
- Right-click on Save
- Select "Export To Text File"
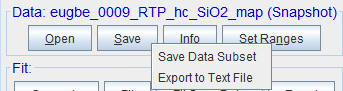
- Choose the .SE files you want to export as txt
- Choose your destination folder (generally O:/CleanroomDrive/phosphosulphides/...)
- Choose file type dat (does not matter)
- In Edit Fit Parameter, select export format Table format
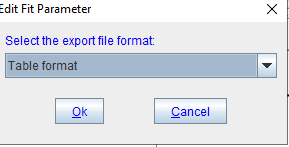
- The exported file name should reflect the original name, make sure the original file name is right
Example filename: eugbe_0020_Zr_BR_tabulated.txt
This is your tabulated data file for the NOMAD tabulated file upload field.
1.8 Prepare Native Files (.se and .snapshot)
Keep both native CompleteEASE files for upload:
.sefile.snapshotfile
You'll upload both to NOMAD in addition to the exported text files.
Example filenames:
eugbe_0020_Zr_BR.seeugbe_0020_Zr_BR.snapshot
Snapshot Parsing
The snapshot file is currently uploaded for archival but not automatically parsed. Future versions may extract data directly from snapshot files.
Step 2: Navigate to Your Upload
- Log into NOMAD Oasis
- Go to the sputtering upload where your combinatorial libraries were created
- Click on the upload to open it
Finding Your Upload
Use the search function or filter by your username to quickly locate your uploads.
Step 3: Create Ellipsometry Measurement Entry
3.1 Start Schema Creation
Click "Create from schema" in your upload.
3.2 Name and Select Schema
Follow the naming convention:
Examples:
eugbe_0020_Zr_BR_Ellipsometry(back right quarter)username_0123_BaZr_FL_Ellipsometry(front left quarter)
Select the schema:
- Choose "Ellipsometry Measurement" from the Built-in schemas dropdown
Click "Create".
Step 4: Upload Ellipsometry Data
4.1 Locate the File Upload Fields
Scroll down in the ellipsometry entry to find the upload fields:
- n&k file - For optical constants data
- Thickness file - For thickness and fit parameters
- tabulated file - For raw Psi/Delta table data
- native .SE file - For the native measurement data
- Snapshot file - For the original CompleteEASE file
4.2 Upload n&k File
- Locate the "n&k file" upload field
- Click the upload area or drag and drop your
*_nk.txtfile - IMPORTANT: Click "Save" immediately after the file uploads
Must Save!
Failing to save after uploading will result in data loss. Always click "Save" after file uploads.
4.3 Upload Thickness File
- Locate the "Thickness file" upload field
- Upload your
*_th.txtfile - Click "Save" immediately
4.4 Upload Tabulated File
- Locate the "tabulated file" upload field
- Upload your
*_tabulated.txtfile - Click "Save" immediately
4.5 Upload Native .SE File
- Locate the "native .SE file" upload field
- Upload your
.sefile from CompleteEASE - Click "Save" immediately
4.6 Upload Snapshot File
- Locate the "Snapshot file" upload field
- Upload your
.snapshotfile from CompleteEASE - Click "Save" immediately
Processing Time
NOMAD processes the files and extracts:
- Optical constants (n, k) at each wavelength and position
- Film thickness across the measured area
- Roughness and other parameters
- Fit quality metrics (MSE)
- Relationships to the combinatorial library geometry
Step 5: Review Results
5.1 Navigate to Results Subsection
Scroll down to find the "Results" subsection and expand it.
5.2 Examine Auto-Generated Plots
NOMAD automatically generates visualizations showing:
- Thickness vs. position (heatmap)
- Refractive index (n) vs. position
- Extinction coefficient (k) vs. position
- n and k vs. wavelength at different positions
- Roughness distribution
- MSE fit quality map
All measurement points from your data files are displayed in the graphs.
5.3 Verify Data Quality
Check the plots for:
- Thickness uniformity or expected gradients
- Reasonable n&k values (n typically 1.5-4 for most materials)
- Low MSE values (≤ 10 for good fits, shown in fit quality map)
- Consistent roughness across the sample
Step 6: Clean Invalid Data Points (If Needed)
During ellipsometry mapping, you might have:
- Points with poor fits (high MSE)
- Measurements on bare substrate
- Edge effects
- Outliers
6.1 Identify Bad Points
Review the plots and identify suspicious data:
- Very high MSE values (> 20)
- Unreasonable thickness values
- Points in unmeasured regions
- Outliers inconsistent with neighbors
6.2 Delete Invalid Points
- Locate the data point in the list (usually shown with coordinates)
- Click the trash can icon next to the invalid point
- Click "Save" after each deletion
Save After Each Deletion
Changes aren't final until you save. Always click "Save" after removing points.
Step 7: Repeat for Additional Quarters
If you measured multiple quarters of your combinatorial library, repeat this entire process for each quarter:
-
Export n&k, thickness, tabulated, and native files with the appropriate quarter identifier:
username_####_Material_BR_nk.txt,*_th.txt,*_tabulated.txt,*.se,*.snapshotusername_####_Material_BL_nk.txt,*_th.txt,*_tabulated.txt,*.se,*.snapshotusername_####_Material_FL_nk.txt,*_th.txt,*_tabulated.txt,*.se,*.snapshotusername_####_Material_FR_nk.txt,*_th.txt,*_tabulated.txt,*.se,*.snapshot
-
Create new Ellipsometry Measurement entries for each quarter
-
Upload the corresponding files
-
Review results and clean data if needed
Mapping Strategy
Quarters are commonly measured individually. This allows:
- Manageable data processing
- Easier quality control
- Parallel characterization workflows
- Better organization in NOMAD
Verification Checklist
After uploading ellipsometry data, verify:
- [ ] Entry named correctly with quarter identifier
- [ ] n&k file uploaded successfully
- [ ] Thickness file uploaded successfully
- [ ] Tabulated file uploaded successfully
- [ ] Native .SE file uploaded successfully
- [ ] Snapshot file uploaded successfully
- [ ] Results subsection shows plots
- [ ] Thickness values are reasonable (typically nm to hundreds of nm)
- [ ] n&k values make physical sense
- [ ] MSE values indicate good fits (≤ 10 preferred)
- [ ] Invalid points removed (if any)
- [ ] Final save completed
Troubleshooting
No plots appear in Results section
Problem: Results subsection is empty or shows errors
Solutions:
- Check file formats - ensure
.txtfiles are properly formatted - Verify files exported correctly from CompleteEASE
- Check that you clicked "Save"
- Refresh the page and wait for processing
- Ensure n&k, thickness, and tabulated files have correct column structure
Wrong data appears in plots
Problem: Plots show unexpected values or positions
Solutions:
- Verify you uploaded files from the correct measurement
- Check that files correspond to the correct quarter
- Confirm naming convention matches the quarter being uploaded
- Re-export from CompleteEASE and verify data integrity
- Check that position coordinates in files match library geometry
High MSE values throughout
Problem: Fit quality is poor (MSE > 20) for many points
Solutions:
- Review fits in CompleteEASE software
- Adjust fitting model or parameters
- Check measurement quality (angles, wavelengths)
- Consider if sample has rough surface or is inhomogeneous
- May need to re-measure problematic areas
File upload rejected
Problem: Files won't upload or show errors
Solutions:
- Verify exported text files are in the expected plain-text formats (
.txtand.txt) - Check file size (should be ≤ 5 MB typically)
- Ensure files aren't corrupted
- Try opening files in a text editor to verify content
- Re-export from CompleteEASE
- Check file permissions
Thickness values seem wrong
Problem: Thickness much higher or lower than expected
Solutions:
- Verify fitting model in CompleteEASE
- Check if substrate is correctly defined
- Review layer stack configuration
- Confirm units (nm vs. Å vs. µm)
- Check if multiple layers are being summed incorrectly
Can't delete data points
Problem: Trash icon missing or not working
Solutions:
- Ensure you're in edit mode
- Check you have write permissions on the upload
- Try refreshing the page
- Verify the entry isn't published/locked
Understanding Ellipsometry Data
What does ellipsometry measure?
Ellipsometry provides:
- Film thickness - Accurate thickness determination (Å precision)
- Refractive index (n) - Real part of complex refractive index
- Extinction coefficient (k) - Imaginary part related to absorption
- Surface roughness - Rms roughness of film surface
- Layer properties - Can characterize multi-layer stacks
Measurement considerations:
- Model-dependent: Results depend on the fitting model used
- Wavelength range: Typically UV-visible-NIR (200-1000 nm)
- Spot size: ~1-3 mm (larger than EDX or Raman)
- Substrate effects: Must account for substrate optical properties
- Thickness range: Most accurate for films 10 nm - 10 µm
Data interpretation:
Use the visualizations to:
- Map film thickness across combinatorial libraries
- Identify optical constant variations with composition
- Correlate thickness with deposition conditions
- Find composition regions with desired optical properties
- Verify film uniformity or intentional gradients
Fit quality (MSE):
- MSE < 5: Excellent fit
- MSE 5-10: Good fit
- MSE 10-20: Acceptable, may need review
- MSE > 20: Poor fit, check model or measurement
Next Steps
After adding ellipsometry measurements:
- Add EDX Measurements - Correlate optical properties with composition
- Add XRD Measurements - Link optical properties to crystal structure
- Add Raman Measurements - Complement with vibrational spectroscopy
- Export High-Quality Figures - Create publication-ready plots
Related Resources
- Upload Sputtering Data - Create the parent combinatorial library
- Ellipsometry Reference - Detailed schema documentation
- Combinatorial Libraries - Understanding the data model
- Characterization Overview - General characterization workflow
Need Help?
If you encounter issues:
- Check the troubleshooting section above
- Review the characterization explanation
- Ask in the NOMAD Discord
- Contact your local NOMAD administrator
- Open an issue on GitHub